Mixed Attribution Modelling
Abstract
Mix Attribution Modelling (MAM) is a combination of Digital Attribution and MMM. MAM takes the best from both techniques and provides accurate and timely attribution of not only digital but offline channels and other external factors. The technique uses event level conversions data linked to as many digital touchpoints as possible and then uses a probabilistic technique to link non-trackable online touchpoints, offline channels, and external factors. As a result, attribution will be given not just to trackable online media, but offline channels, seasonality, economic, demographic, geographic factors, etc. This technique requires at least 6 months’ worth of event-level data, and it is recommended to undertake the analysis at the highest available frequency (i.e. daily, hourly or minute-by-minute) and as geographically granular as possible.
Marketing Mix Model (MMM) and Digital Attribution (known as well as Multi-Touch Attribution, MTA) are two well-known approaches to quantify the impact of marketing and advertising activities on the modelled KPI (such as sales, subscriptions, or other conversion types).
In the MMM, modelers regress specific aggregated KPI on a set of independent variables (that capture all marketing indicators including price, promotions, media advertising, and external factors). It is based on the well-established statistical theory. The technique allows disentangling the contributions of individual factors and quantifying the impact of bigger marketing activities on the modelled metric.
The MTA uses much more granular data that enables measuring the impact of individual digital touch points that took place on a specific path to conversion. Web-analytics and other digital data can be incorporated into the MTA model to quantify the contribution of own assets to conversions.
Table 1 below summarizes the key differences in a way MMM vs MTA measures the impact of media communications.
|
Difference Type |
MMM |
MTA |
|
Length of modelled period |
2-3 years of weekly aggregated data. |
Several months of touch-point digital journeys. |
|
Incremental vs overall impact |
Measure the incremental impact of advertising, i.e. above the ‘base line’ of measured KPI. |
Measures the overall impact of advertising (no differentiation between the base and incremental conversions).[1] |
|
Holistic evaluation of all factors vs detailed evaluation of digital |
Holistic – considers all contributing factors (including non-marketing, external, competition). |
Granular evaluation of digital channels only. |
|
Impact of entire customer journey vs short-term impact analysis |
Uses adstocking to capture the impact of activities that took place in several previous periods. |
Incorporates touch points on the entire measured customer journey. |
The listed differences imply trade-offs between the two approaches. What approach is more suitable depends on:
- The brand presence online or offline (such us in store).
- The proportion of media budget invested in online media (or other directly trackable channels) or offline channels.
- Access to data at a user vs an aggregated level.
- How individual off-line channels perform at different stages of the customer journey – what is their longer-term impact?
- How to best split the budget considering integrated knowledge about the measured performance of digital and offline channels
- Ideally, the data need to be collected at the same frequency and granularity.
- Methodology needs to be suitable for a large volume of data and a variety of media variables.
- The MAM does not require long periods of data collection. Modelling with the MAM can be performed with as little as six months of daily data.
- The model can capture base sales/conversions (baseline) but given that it is run on individual-level data. However, the baseline can be lower compared to the MMM model improving model accuracy in terms of uplift driven by media.
- The MAM takes into account all contributing factors similarly as the MMM does. In this way, it overcomes the limitation of the MTA that typically modells only digital touchpoints.
- While the MMM, run on aggregated weekly series, gave credit for the modelled KPI uplift only to those media activities that took place in the same period or several periods earlier (through adstocking); the MAM, modelled on individual level sales, incorporates touch points from the entire measured customer journey and therefore it more accurately measures the actual media impact on respective sales.
Careful consideration of these factors helps to determine which model is more useful or feasible or if the brand can benefit from both solutions.
With an increasing share of media budgets diverted into cost-effective, innovative ways of marketing in digital space and the need for marketing agility tip the scales in favor of models that can be actioned more frequently, and do not require long periods of data collection.[2]
While there is an increasing pool of marketers that collect a significant proportion of data at an individual level, invest largely into online media, are active in higher involvement categories (with longer purchase journey), they often prefer to run both the MTA and the MMM models that will complement each other. However, they provide input into different types of recommendations and it is difficult to link the results from the two models.
In addition, important questions remained unanswered:
Ideally, one should run a hybrid type of model that will have the benefits of both MMM and MTA and in this way to mitigate their trade-offs. The approach that would incorporate all information: at an individual level as well as shared exposure to offline advertising and other marketing or external factors.
There are multiple challenges.
Our team at SD Group has been working on the solution that would mitigate the trade-offs between the MMM and the MTA and help our clients fully benefit from all their data in a single modelling framework.
Our new modelling approach – Mixed Attribution Modelling.
The MAM takes as a starting point the data available at the most granular (individual or cookie-level). These are individual-level sales, subscriptions or other conversions tracked individually as well as all touchpoints that can be attributed to a specific sale. These include a variety of online advertising, search, and any other sources collected through digital analytics tools.
Since the MAM originates from the MTA – it is important to establish ancestry to algorithms used in the MTA.
In our business experience, we are used to working with Hidden Markov Model (HMM) and Last Interaction Attribution (LIA)[3]. Our expectation is the MAM should produce results close to current industry applied models.
The chart below presents a comparison of the reference MTA models vs the MAM:
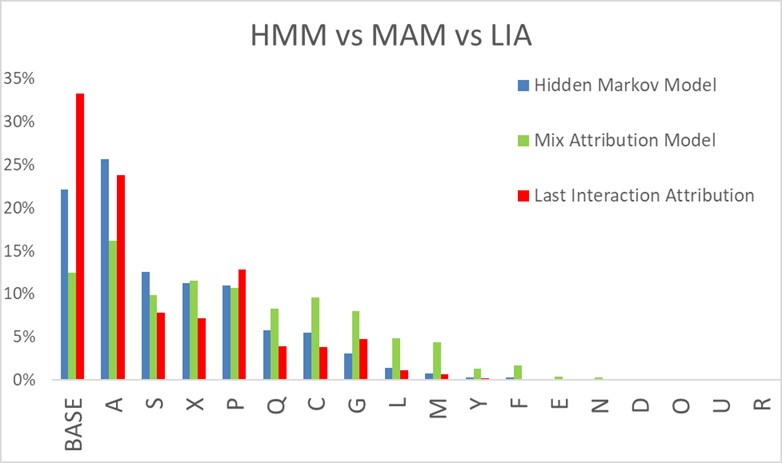
BASE stands for the base-line. Letters represent different digital publishers. Columns represent % of conversions attributed to respective publishers.
The chart shows that the results of all three models are aligned. The MAM results provided more equally distributed contributions among digital publishers.
While digital channels are well measured, we can perform a quick comparison of scenarios when some publishers are no longer integrated into individual digital journeys and provide only aggregated series of daily exposures. The chart below presents a comparison.

The green bar shows the MAM results when all digital channels are captured at the individual level. Red bars show the results when some digital channels (G, O, and F) are not anymore captured as part of the digital journey – highlighted in blue - and provide only aggregated daily series. The chart shows that for the publishers G and O the total impact slightly decreased[4]. As for publisher F – its impact substantially increased. The other publishers did not experience any significant changes in attribution.
Overall, this demonstrates that the MAM can successfully attribute also when some channel exposures are not tracked at the individual levels and as such can incorporate off-line media and other factors.
In the next step, we investigate the impact of off-line media and other factors. All other sources of information ranging from off-line advertising, other parts of the marketing mix and non-marketing factors were added to the dataset in their most granular form that they can be obtained.

The chart above presents a comparison of the MAM run on only digital data vs scenario when in addition where added data on holidays, economy, Google trends, and off-line media activity[5].
As in previous scenarios – the inclusion of non-digital data does not significantly change the results. Attributions were reduced to reflect more accurate “dissection of reality”. Holidays and Media got substantial attribution. In production, the Media will have stronger impact, since in these results we do not account for adstocking.
Presented results demonstrate the capability of our new modelling technique, the MAM. Here we highlight the most important advantages of the MAM:
To sum up, the MAM enables to benefit fully from the data available at a very granular level, while it is at the same time able to integrate into the model the data points available at different frequency or granularity.
The MAM is particularly suitable for marketers of high-involvement goods with longer purchase cycles. When it comes to categories in which customers take longer and make more research before, they make their choice, (often associated with the higher purchase price or transaction related costs), it is essential to understand what shapes the decision-making process and how media communication affects this process at different stages.
Q’n’A:
Q: What is the preferred modelling period?
A: Several months of individual digital journey overlaid with other data relevant for that period.
Q: Can the MAM measure the incremental impact of advertising?
A: Yes, the MAM estimates the baseline and detailed advertising impact.
Q: Can the MAM measure the impact of other (external) factors?
A: Yes, the MAM can measure the impact of holidays, seasonality, halo and cannibalization.
[1] Originally the MTA was used for digital start-ups, whose sales were/are only through the Internet. In the current time (2019) – the Internet as sales channel became as accepted as a brick-and-mortar store. The implication – now attribution should include the base line – case when the conversion happens “out of blue”.
[2] Recent developments in privacy regulations will make some individual-level data sources not available or/and disjoint from the observed digital journey.
[3] There is as well Shapley Model, but computational complexity and time required to process cases when number of channels/categories exceeds 20 makes it not practical.
[4] Both channels belong to same entity differentiated by international and Australia only activity.
[5] Here and before is used simulated data with characteristics similar to actual data.
You may be interested in

Consulting

MAD CAW